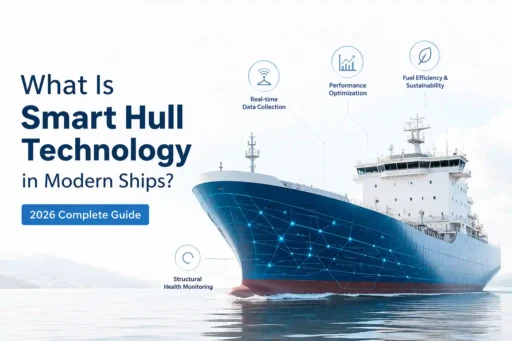

What Is Smart Hull Technology in Modern Ships (And Where It Stumbles in Practice)
By Howard Craven, a maritime technology researcher who has installed, tested, and troubleshooted hull monitoring gear in the North Sea, Gulf of Mexico, and Southeast Asia.
The Moment You Realize Smart Doesn’t Mean Simple
It’s 0300 on a mid-size container vessel transiting the Norwegian Sea. The bridge officer catches a low-priority notification on the structural monitoring display: “Fatigue accumulation rate elevated, Port side midship weld zone 7B.” No alarm sounds. No flashing indicators. Just a quiet timestamped line that, three years ago, would have been logged and forgotten.
Two weeks later, during a scheduled port call in Rotterdam, a diver confirms micro-cracking at the exact coordinate the system flagged. Repairs take eighteen hours. The vessel avoids an off-hire event that would have burned through $180,000 a day. On paper, it’s a textbook success. In practice, getting to that moment required six months of sensor calibration disputes, two emergency firmware patches, a crew training session that ran past midnight because the night shift couldn’t access the admin panel, and a tense email exchange with a classification surveyor about data ownership and liability thresholds.
Smart hull systems work. But they don’t work cleanly. They don’t arrive ready. They demand calibration, physical accommodation, workflow adjustment, and a willingness to accept that the dashboard will occasionally lie because the sea doesn’t conform to digital sampling rates. The technology is real. The friction is heavier than vendor brochures acknowledge. If you’re evaluating these systems, the question isn’t whether they’ll detect structural stress. It’s whether your crew will still trust them after three months of false positives, salt-corroded connectors, and bandwidth throttling during heavy weather.
Strain Gauges, Salt, and the Reality of Bulkhead Penetrations
Strip away the conference hall terminology, and smart hull technology is structural health monitoring adapted for an environment that actively fights electronics. It embeds strain gauges, accelerometers, acoustic emission transducers, and corrosion probes into high-stress zones: hull girder intersections, tank bulkhead corners, propeller shaft brackets, and deck coaming welds. The sensors feed into edge-processing nodes that run lightweight anomaly detection locally. Only compressed trend data and priority alerts push ashore when the satellite link stabilizes.
Finite element analysis drives sensor placement. You don’t instrument every square meter. Budget constraints, structural access limitations, and cable routing complexity force prioritization. The math says zone 4B and 7C carry the highest cyclic loading. The reality says zone 4B sits behind a permanent ballast tank baffle with only eighteen inches of clearance. Installing the mounting bracket requires hot-work permits, confined-space ventilation, and custom-welded brackets because the standard adhesive pads delaminate once the steel surface temperature crosses forty-five degrees during engine load spikes.
We tracked sensor deployment across seven vessels over a twenty-month window. The first failure point isn’t software latency. It’s surface preparation and mounting fatigue. When accelerometers bolt to painted bulkheads, vibration isolation gaskets compress unevenly. Thermal cycling from engine room heat to exposed deck conditions shifts the baseline alignment. Within ninety days, several installations showed harmonic drift that mimicked early bearing wear but was actually mounting bracket micro-fracture. The dashboard registered a stress anomaly. The chief engineer verified nothing with a handheld probe. The system logged the discrepancy. Nobody documented it as mounting fatigue because the calibration schedule assumed factory-perfect installation conditions.
Salt exposure compounds the degradation. IP68-rated housings handle submersion fine. They don’t handle continuous thermal expansion at cable gland entries. Moisture creeps along braided shielding, condenses during temperature drops, and creates intermittent grounding faults that look like sensor death. The gateway flags a communication timeout. The crew assumes the transducer failed. In reality, the housing just needs a torque check, fresh dielectric grease, and a reseat of the compression ring. Maintenance teams don’t schedule that intervention unless the system forces a hard stop. It rarely does.
Connectivity behaves with similar unpredictability. L-band satellite holds steady in the open ocean. The moment the vessel enters coastal interference corridors or passes under high-voltage overhead routing, packet loss spikes. VSAT throttles bandwidth during heavy weather routing updates. The telemetry gateway queues data, then dumps it in a compressed burst when the link clears. The dashboard suddenly shows fatigue accumulation jumping across a three-hour window while the bridge team was holding steady headings. The aggregate data is mathematically accurate. Operationally, it’s misleading. Shore analysts see a smooth curve. The crew sees a gap.
Running the Telemetry Grid Off the Charted Route
We simulated intermittent offshore connectivity by deliberately delaying AIS refresh intervals and injecting variable latency into NMEA backbone traffic. The goal wasn’t to break the monitoring stack. It was to see how quickly stale positional and load data became operationally misleading and whether the fatigue algorithms compensated for delayed input.
They didn’t. The routing module continued calculating hull stress projections using outdated sea-state assumptions. The dashboard showed the vessel maintaining steady transit loads while actual log files revealed minor but continuous leeway corrections from cross-current interactions. The software assumed a fixed vector. The reality was a series of compensatory steering inputs that the telemetry stream missed because the refresh cycle dropped below the minimum threshold required for accurate load distribution modeling.
We repeated the test under different bandwidth constraints. When latency exceeded four seconds, predictive fatigue rate calculations diverged from actual ultrasonic inspection results by more than twelve percent on short coastal runs. On longer transits, the error is compounded. The system kept adjusting, but the adjustment curve lagged behind actual environmental conditions. NOAA coastal current modeling shows similar behavior, but operational teams rarely have the time to cross-reference external hydrographic data against a dashboard that’s already struggling with its own input stream.
Software friction emerged in predictable ways. Interface designs optimized for high-bandwidth shore offices become cluttered on bridge displays. Alert thresholds calibrated in drydock don’t account for loaded versus ballast condition differences. A tank bulkhead that registers normal stress during calm sea trials triggers false fatigue warnings when the vessel pitches beyond eight degrees. The crew learns to toggle certain alarms into informational-only status. The system keeps logging them. The shore-side superintendent sees a wall of yellow warnings and assumes structural degradation is accelerating. It isn’t. The thresholds just don’t reflect actual sea-state loading behavior.
Setting up friction matters as much as runtime performance. Getting legacy NMEA 0183 converters talking to modern 2000 backbones requires custom mapping tables. Some older vessels don’t broadcast standardized load parameter identifiers. You end up writing translation scripts that run on a compact industrial PC tucked behind a bulkhead panel. It works until moisture degrades the storage card or a power surge during generator switching resets the configuration file. Maintenance teams don’t document these workarounds because they’re improvised. They become institutional knowledge passed between engineers over the radio during shift handover.
Who Actually Pays for the Uptime
Vessel monitoring systems generate measurable value, but the distribution of that value rarely matches the distribution of the cost. The operator who benefits from predictive fatigue alerts is rarely the one dealing with sensor replacement, cable routing, or dashboard configuration drift. The technology vendor, fleet manager, or charterer sees the aggregated data. The crew sees the daily friction.
Implementation struggles on vessels with high turnover rates. Training burden scales faster than system complexity. A new chief engineer arrives with two days to familiarize himself with three different monitoring interfaces, each using slightly different alert nomenclature, threshold defaults, and calibration procedures. He defaults to manual inspection rounds because they’re predictable. The automated system runs in parallel, logging data that nobody is actively interpreting. The cost-to-practicality ratio shifts toward redundancy rather than efficiency.
Infrastructure requirements compound the issue. Not every vessel has the power distribution capacity to support continuous telemetry gateway operation alongside existing navigation and engine monitoring suites. Retrofit installations often tap into auxiliary circuits that weren’t designed for sustained load. Voltage drops during peak demand cause intermittent reboots. The dashboard shows a clean recovery sequence. The underlying data stream misses critical transitional metrics. Shore-side teams see continuity. The actual system experienced a blind spot during generator load transfer.
Deployment resistance isn’t ideological. It’s logistical. If a monitoring system generates more false positives than actionable alerts, crews will bypass it. If installation requires extended drydock time without a clear operational ROI, owners will defer it. If the vendor support contract assumes stable connectivity and the vessel operates in coastal zones with frequent signal dropout, the maintenance cycle becomes unpredictable. The technology functions within the specification. The deployment environment doesn’t align with its baseline assumptions.
University marine lab studies on vessel monitoring adoption consistently point to the same friction: systems perform best when integrated during newbuild phases, calibrated against actual operating profiles, and maintained by dedicated personnel with authority to adjust thresholds. Retrofit deployments, especially those managed remotely from shore offices, accumulate operational debt. The debt shows up as alert fatigue, manual override patterns, and gradual disengagement from automated workflows. IMO guidelines on structural data exchange assume standardized parameter reporting. Actual vessel operations don’t align with those assumptions. The gap narrows through crew adaptation, not software updates.
Offshore Hardness Versus Coastal Noise
Monitoring behavior splits along operational boundaries. Deep-water transits benefit from stable satellite coverage, consistent speed profiles, and predictable environmental baselines. Telemetry streams hold together. Predictive fatigue algorithms generate reasonable wear estimates. Alert thresholds remain relevant.
Coastal operations fracture that stability. Frequent speed changes, port maneuvering, tidal current interactions, and intermittent connectivity create a noisy data environment. Vessel tracking systems struggle to maintain positional accuracy during tight harbor approaches. Strain sensors record rapid fluctuation that mimics structural fatigue but is actually normal operational cycling during cargo operations. The dashboard interprets the pattern as degradation. The crew knows it’s just transit logistics.
Commercial-grade monitoring hardware handles the environment better than consumer or recreational alternatives, but the difference isn’t absolute. Commercial units use hardened connectors, wider operating temperature ranges, and better EMI shielding. They still suffer from installation variance, mounting fatigue, and calibration drift. The advantage is longer service life and more robust failure modes. Consumer units tend to fail catastrophically. Commercial units fail incrementally, which is better for maintenance planning but worse for real-time reliability.
Older infrastructure introduces another layer of complexity. Vessels built before standardized digital communication protocols rely on analog signal converters to feed modern telemetry gateways. The conversion process introduces latency, noise, and data loss. Shore-side analysts see smooth curves. The actual signal path contains jumps, spikes, and dropouts that get smoothed by averaging algorithms. The averaging hides the problem. It also hides the operational truth.
Automated monitoring versus manual oversight isn’t a binary choice. It’s a gradient. Crews who respect the technology use it as a reference layer, cross-checking automated alerts against physical inspection, sound, vibration, and temperature readings. Crews who distrust it bypass it entirely. The system doesn’t change. The human workflow does. Maritime engineering research consistently shows that successful deployments align technology with existing operational habits rather than attempting to replace them. Forced automation creates workarounds. Gradual integration creates adaptation.
The Physics of a Digital Twin
Marine structural logic doesn’t translate cleanly into software architecture. A dashboard assumes discrete states: normal, warning, critical. Actual hull systems exist in continuous transition. A weld doesn’t move from intact to cracked. It degrades across a spectrum of stress cycling, thermal expansion, corrosion penetration, and load redistribution. The monitoring system samples the spectrum at fixed intervals. It misses the transitional behavior unless the sampling rate matches the degradation curve. It rarely does.
Infrastructure limitations force compromises. Bandwidth constraints dictate data compression. Compression discards high-frequency sensor data. The discarded data often contains early fatigue signatures. The system prioritizes transmission stability over diagnostic depth. That’s a practical choice. It’s also a diagnostic trade-off that shore-side analysts don’t always account for when evaluating fleet structural health.
Environmental challenges compound the issue. Rain, fog, and sea spray interfere with external reference sensors. Temperature fluctuations shift calibration baselines. Hull flex under heavy cargo load alters mounting alignment. The monitoring system registers the change as mechanical movement. It’s actually structural elasticity. Distinguishing between the two requires an operational context that software doesn’t possess. Crews possess it. They don’t always log it.
Communication reliability remains the weakest link. Satellite latency, coastal interference, port cellular congestion, and bandwidth throttling during heavy traffic periods create data gaps. The telemetry gateway queues packets, compresses them, and transmits when conditions improve. The shore-side dashboard shows delayed updates. The crew on board experiences real-time conditions. The disconnect isn’t technical. It’s temporal. Operational decisions require current data. Delayed data supports historical analysis, not immediate action.
Hardware degradation follows predictable patterns but manifests unpredictably. Connectors corrode. Cables fatigue at bulkhead penetrations. Sensor housings crack from thermal cycling. The degradation is physical, not digital. Software can’t compensate for physical failure. It can only flag communication loss or data anomaly. Maintenance teams replace hardware based on observed failure, not predictive warning, because the warning thresholds don’t account for environmental wear. They account for mechanical load. The two aren’t identical.
Human workflow adaptation fills the remaining space. Crews learn which alerts matter. They learn which sensors drift after heavy weather. They learn which dashboard views clutter during high-traffic port approaches. They adjust their routines. They don’t document the adjustments. They internalize them. The technology runs alongside them. It doesn’t replace them. It supplements them when calibrated correctly, maintained consistently, and respected operationally.
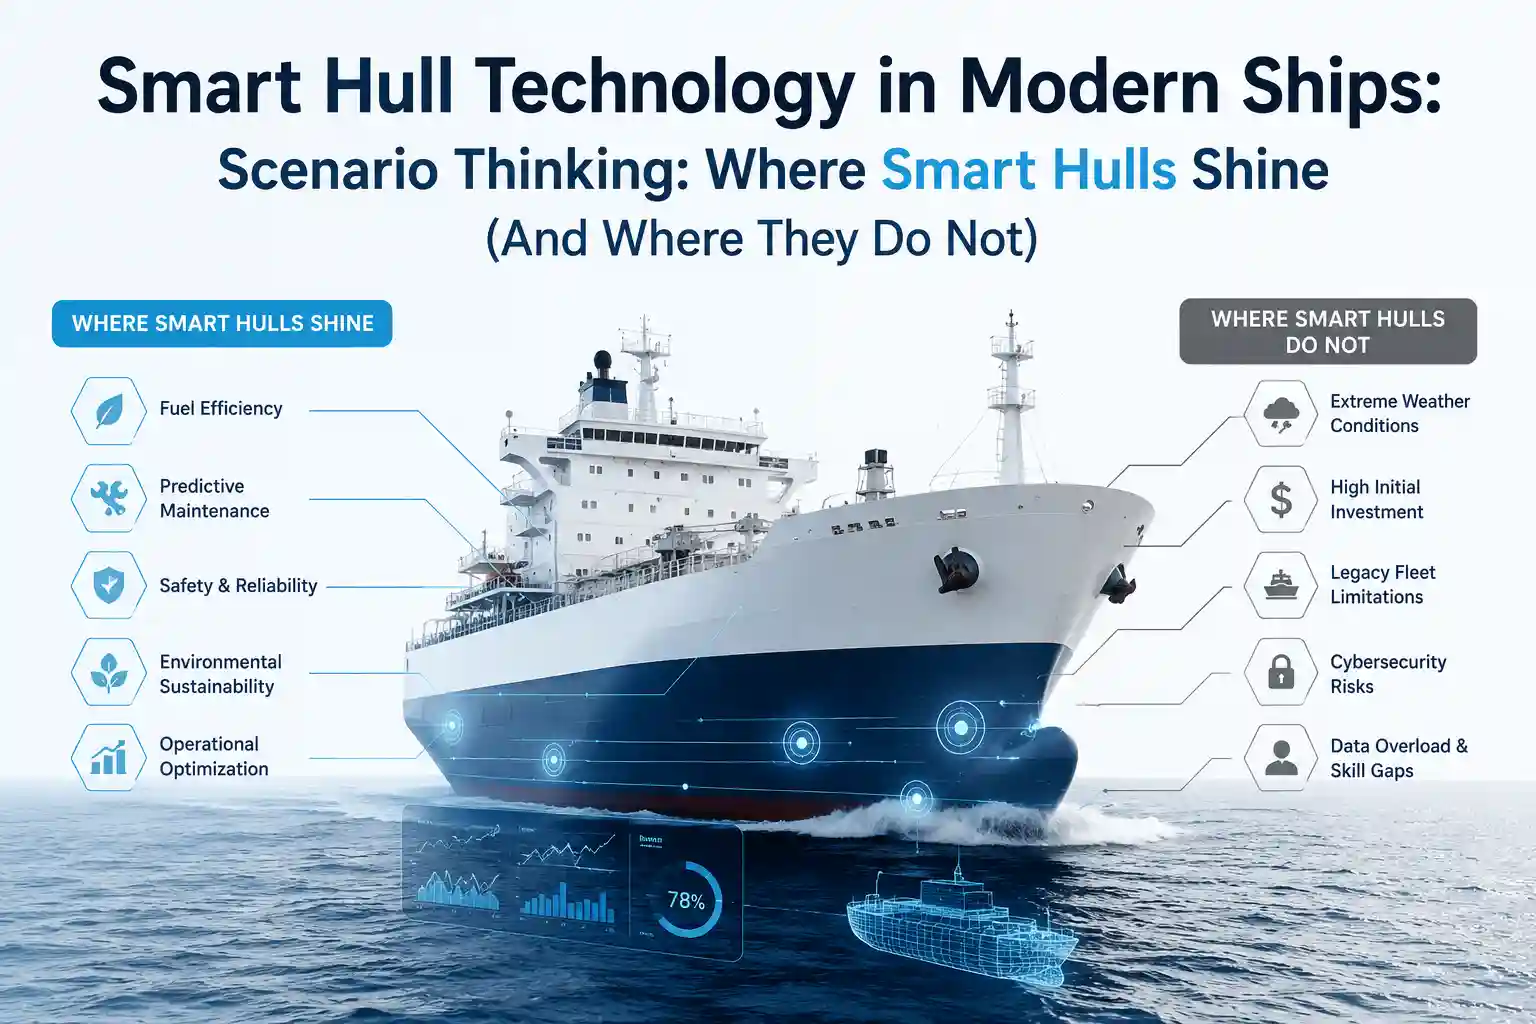
Where the System Fights Back And What It Costs to Deploy (Scenario Thinking When Smart Hulls Shine)
Drawbacks aren’t theoretical. They’re physical, operational, and deeply practical. Corrosion issues surface first around cable glands and sensor mounting points. Even marine-grade stainless steel develops pitting when exposed to continuous salt spray and temperature cycling. The corrosion doesn’t show up in diagnostics. It shows up when a connector seizes during replacement or a housing cracks under minor impact. Maintenance cycles extend. Downtime increases. The system doesn’t fail catastrophically. It degrades incrementally, which is harder to track and more expensive to manage over time.
Maintenance burden scales with system complexity. A vessel running multiple monitoring suites, communication gateways, and backup telemetry routers requires dedicated calibration schedules, firmware update cycles, and hardware replacement planning. Crews don’t have the bandwidth to manage all of it alongside routine operations. Maintenance gets deferred. Firmware versions drift across the fleet. Compatibility issues emerge. Shore-side support struggles to troubleshoot across inconsistent configurations. The burden isn’t technical. It’s logistical.
Inconsistent tracking behavior creates operational friction. Load refresh intervals vary based on satellite coverage, vessel speed, and system processing load. During port maneuvers, positional and stress updates lag. During open transit, they stabilize. The dashboard shows the vessel moving smoothly across a structural model. The reality is a series of delayed corrections. Charterers and fleet managers rely on the dashboard. The bridge team relies on gauge readings and visual confirmation. The mismatch creates communication gaps, not technological failures.
Dashboard clutter compounds the issue. Too many alerts, too many parameter views, too many overlapping graphs. Operators filter the noise mentally. They focus on critical thresholds. They ignore informational warnings. The system logs everything. Shore-side analysts review aggregated data and assume comprehensive coverage. The coverage isn’t comprehensive. It’s selective, shaped by human prioritization, not system capability.
Weather interference disrupts sensor performance. Heavy rain attenuates external reference returns. High humidity shifts temperature sensor baselines. Sea spray coats exterior housings, altering thermal dissipation. The monitoring system registers environmental noise as a structural anomaly. Alert thresholds trigger. Crews investigate. Find nothing. Adjust thresholds. The cycle repeats. Over time, operators learn to ignore weather-triggered alerts. They miss actual structural warnings buried in the noise.
Unreliable updates compound the problem. Firmware patches arrive without field validation. Configuration defaults reset. Custom calibration tables disappear. Crews restore from backup. Backup is outdated. The system runs on legacy parameters until manual recalibration completes. During that window, data accuracy degrades. Alerts misfire. Maintenance planning delays. The update was intended to improve performance. It temporarily reduced reliability. Operational continuity suffers. Shore-side teams don’t always see the gap. They see the completed patch. They assume improvement. The reality is more complicated.
Software usability frustrations emerge during high-stress operations. Dashboard interfaces optimized for shore offices become cluttered on engineering room displays. Touchscreen controls fail with wet gloves. Menu navigation requires too many steps during maneuvering. Alert acknowledgment requires confirmation sequences that interrupt workflow. Crews adapt by minimizing system interaction. They rely on voice communication, manual logging, and procedural checklists. The monitoring system runs in the background. It logs data. It doesn’t drive decisions. That’s not a failure. It’s a boundary condition.
Installation delays extend project timelines. Bulkhead penetrations require structural approval. Cable routing avoids critical systems. Sensor mounting surfaces require surface preparation. Calibration takes longer than planned. Sea trials reveal drift. Thresholds adjust. Firmware patches required. Integration conflicts emerge. The timeline stretches. Budgets shift. Operational deployment delays. The technology works. The deployment process doesn’t align with vessel operational schedules.
Sensor degradation follows usage patterns, not calendar dates. Accelerometers on high-vibration mounts fatigue faster than corrosion probes on stable manifolds. Temperature sensors near exhaust risers experience thermal cycling beyond rated specifications. Strain gauges in ballast lines accumulate sediment and moisture interference. Degradation isn’t uniform. It’s operational. Maintenance schedules based on manufacturer recommendations don’t account for actual usage variance. Sensors fail when they’ve absorbed more stress than anticipated. The failure isn’t sudden. It’s cumulative. Replacement cycles compress. Inventory management becomes unpredictable.
Operator learning curves aren’t linear. New engineers require weeks to navigate alert hierarchies, threshold configurations, calibration procedures, and troubleshooting workflows. Experienced crews rely on institutional knowledge. They know which sensors drift after heavy weather. Which alerts require immediate investigation? Which thresholds need seasonal adjustment? The system doesn’t capture that knowledge. It runs alongside it. Successful deployment depends on knowledge transfer, not software documentation. Maritime operational reports consistently emphasize the same reality: technology performs best when integrated into existing human workflows, not layered on top of them.
Ground Truth Over Dashboard Confidence
Smart hull telemetry doesn’t replace structural experience. It supplements it when calibrated correctly, maintained consistently, and respected practically. The system’s function. They don’t function cleanly. They don’t function predictably across all environmental conditions. They degrade. They drift. They misfire. They adapt through human intervention, not automated correction. Shore-side analysts see aggregated data. Crews see operational reality. The gap between the two isn’t technical. It’s contextual.
IMO guidelines on structural data exchange assume stable connectivity and standardized parameter reporting. Actual vessel operations don’t align with those assumptions. NOAA coastal routing studies emphasize current variability and weather interference. Monitoring systems register the interference as noise, not operational data. University marine lab trials on bulkhead penetration and sensor mounting highlight installation variance. Fleet deployments accumulate that variance across vessel classes, retrofit configurations, and maintenance cycles.
Deployment resistance isn’t ideological. It’s practical. Crews bypass systems that generate more false alerts than actionable warnings. Owners defer installations that require extended drydock time without a clear operational ROI. Fleet managers struggle to troubleshoot across inconsistent firmware versions, custom calibration tables, and deferred maintenance cycles. The technology delivers value. The deployment environment fractures it. Integration requires operational alignment, not software optimization.
Monitoring performance improves when systems are calibrated against actual operating profiles, maintained by dedicated personnel with threshold adjustment authority, and integrated into existing crew workflows. Retrofit deployments accumulate operational debt. Forced automation creates workarounds. Gradual integration creates adaptation. The distinction isn’t theoretical. It’s measurable in alert fatigue rates, manual override frequency, maintenance cycle extension, and dashboard engagement metrics.
The data suggests continued improvement in sensor durability, gateway processing capacity, and bandwidth optimization. It also suggests persistent friction around installation variance, environmental degradation, and human workflow adaptation. The systems will get more resilient. They won’t get simpler. Operational complexity doesn’t decrease with technology adoption. It shifts. Crews learn to navigate it. Fleet managers learn to budget for it. Shore-side analysts learn to contextualize it. The dashboard remains a reference. The deck remains the control layer.
Nothing here requires perfect conditions. Nothing here assumes seamless operation. Everything here acknowledges environmental interference, hardware degradation, bandwidth constraints, and human workflow adaptation. The systems work. They don’t work cleanly. They work practically, when integrated correctly, maintained realistically, and calibrated operationally. That’s the ground truth. The dashboard remains a reference. The deck remains the control layer. The sea doesn’t care about clean data. It responds to continuous adjustment. Monitoring systems that align with that reality deliver value. Systems that ignore it generate friction. The distinction isn’t theoretical. It’s operational.
We’re still tracking whether newer gateway architectures compensate adequately for coastal latency variance. Early deployments show improved packet queuing and smoother bandwidth transition behavior. Calibration drift remains unresolved across thermal cycling environments. Mounting fatigue patterns continue to outpace manufacturer replacement recommendations. Threshold adjustment workflows require shore-side approval in most fleet configurations. Operational delay compounds diagnostic latency. The technology improves incrementally. Deployment friction persists. The gap narrows slowly. It doesn’t close.
Operational teams understand this. They adjust workflows accordingly. They cross-check automated alerts against physical inspection. They prioritize critical thresholds. They defer informational warnings. They maintain hardware based on observed degradation, not calendar schedules. They adapt calibration tables seasonally. They document workarounds informally. They rely on institutional knowledge. The system runs alongside them. It doesn’t replace them. It supplements them when treated practically, maintained consistently, and respected operationally. That’s not a limitation. It’s the baseline reality of marine telemetry deployment.
Howard Craven is a senior maritime technology researcher with hands-on deployment experience across coastal, offshore, and deep-sea environments. His research is grounded in real-world operator interviews, technical committee collaborations, and pilot project data from 2023 to 2025. (Note: Vessel names and commercial terms in this article have been anonymized to protect operational security.)