LiDAR at Sea: Operational Realities of Optical Surveying in Marine Environments
The wiper blade on the sensor housing was streaking. That was the first thing I noticed when I stepped into the wheelhouse of the 65-foot coastal survey catamaran off the Washington coast. Outside, the sea state was a messy Beaufort 4, throwing a continuous mist of salt spray against the forward superstructure. Inside, the chief hydrographer was staring at a primary monitor, watching the real-time point cloud degrade into a fuzzy, unusable static.
“We’re losing the bottom return,” he muttered, tapping the glass. “The optics are fouled again. Tell the deckhand to grab the squeegee and the DI water.”
This is the unglamorous reality of deploying advanced optical sensors in the marine environment. Brochures for vessel-mounted LiDAR (Light Detection and Ranging) systems usually feature pristine 3D renderings of colorful seafloors and perfectly resolved shipwrecks. They rarely mention the deckhand hanging over the bow rail in a survival suit, wiping salt crust off a sapphire sensor window every forty-five minutes just to keep the laser pulses from scattering.
When you move topobathy LiDAR from the belly of a twin-engine aircraft to the mast of a pitching survey boat, the physics of the sensor remain the same, but the operational friction multiplies exponentially. The ocean is an aggressively hostile environment for precision optics, and the gap between theoretical sensor capability and actual data yield is defined entirely by how a crew manages that friction.
The Messy Reality of Vessel-Mounted Optical Surveying
Deploying a high-resolution green laser scanner on a marine vessel requires a delicate balancing act between hardware limits and environmental chaos. Unlike airborne systems that fly at 1,000 feet above the surface, a vessel-mounted unit sits perhaps 15 to 30 feet above the waterline. This proximity provides incredible point density, but it also puts the sensor directly in the splash zone.
During a recent coastal mapping project in the Pacific Northwest, we ran a dual-laser topobathy system. The near-infrared laser handled the topography above the waterline, while the green laser (532 nm) was tasked with penetrating the water column to map the benthic layer. In calm, clear conditions, the system was remarkably effective. We were pulling bathymetric returns down to 12 meters with beautiful resolution.
Then the afternoon sea breeze kicked up.
As the vessel began to pitch, the green laser’s angle of incidence on the water surface changed dynamically. When a wave crest intercepted the laser pulse at a steep angle, the light refracted unpredictably or reflected entirely off the surface. The resulting point cloud looked like the seafloor was suddenly rising and falling in three-meter spikes. The motion reference unit (MRU) was doing its best to compensate for the vessel’s heave and roll, but the MRU can only correct the position of the sensor, not the physical distortion of the laser beam hitting a moving, uneven water surface.
We also encountered severe attenuation from suspended sediment. Following a heavy inland rainfall, the river plume extended two miles offshore. The green laser simply couldn’t punch through the turbid water. The bathymetric returns vanished, leaving us with nothing but surface returns. We had to halt the survey lines, burn fuel steaming back to port, and wait three days for the water to clear. Multibeam echosounders don’t care about water clarity; LiDAR cares deeply.
Hardware inconsistencies also plagued the deployment. The scanner head generates a significant amount of heat. On a cool, overcast day, the internal cooling fans handled it fine. But when the sun broke through and hit the dark-painted sensor housing directly, the internal temperature spiked. The system’s firmware automatically throttled the pulse repetition frequency (PRF) to prevent the laser diode from overheating. Our data density dropped by 40% without warning, forcing us to slow the vessel’s speed to maintain our line spacing requirements.
Practical Testing: The Timestamp Synchronization Nightmare
To understand how these systems fail, you have to look at the integration layer. A LiDAR scanner does not work alone. It relies on a GNSS (Global Navigation Satellite System) receiver for position and a high-grade inertial navigation system (INS) for orientation. If the timing between these three components is off by even a few milliseconds, the resulting 3D model becomes a distorted mess.
I spent two days on a static test range simulating dynamic offshore conditions to observe how timestamp latency affected the data. We mounted the sensor array on a rigid test pillar on the dock. First, we ran a baseline scan. The point cloud of the surrounding dock infrastructure was razor-sharp.
Next, we intentionally introduced a 5-millisecond timing offset between the INS and the LiDAR scanner in the software configuration. On a stationary dock, a 5ms offset is irrelevant. The boat isn’t moving, so the calculated position and orientation remain constant regardless of the timestamp error.
But out on the water, a survey vessel moving at 8 knots and pitching in a swell changes its orientation constantly. When we took the system out with that same 5ms offset, the “ghosting” effect was immediate. Vertical pilings on the nearby pier looked like they were leaning at 15-degree angles. The seafloor returns are duplicated, creating a phantom double-bottom effect in the point cloud.
Fixing this wasn’t a simple software toggle. It required the lead engineer to physically inspect the cable routing. We discovered that the serial data cable from the INS to the scanner was routed too close to the vessel’s primary power inverter, introducing electromagnetic interference that was subtly delaying the data packets. Rerouting the cable and adding a ferrite choke resolved the ghosting, but it cost us an entire day of surveying. This kind of setup friction is entirely absent from the manufacturer’s manuals.
Another testing variable was the boresight calibration—the process of determining the exact angular offset between the laser scanner and the INS. This requires running the vessel over a distinct underwater target (like a sunken concrete block) from four different directions. During our calibration runs, we found that the vessel’s wake was actually disturbing the water surface enough to scatter the green laser on the return pass, degrading the target resolution. We had to reduce speed to 3 knots to minimize the wake, which made the vessel highly susceptible to wind drift, complicating the steering. It was a frustrating loop of operational compromises.
Who Actually Benefits (And Who Struggles)
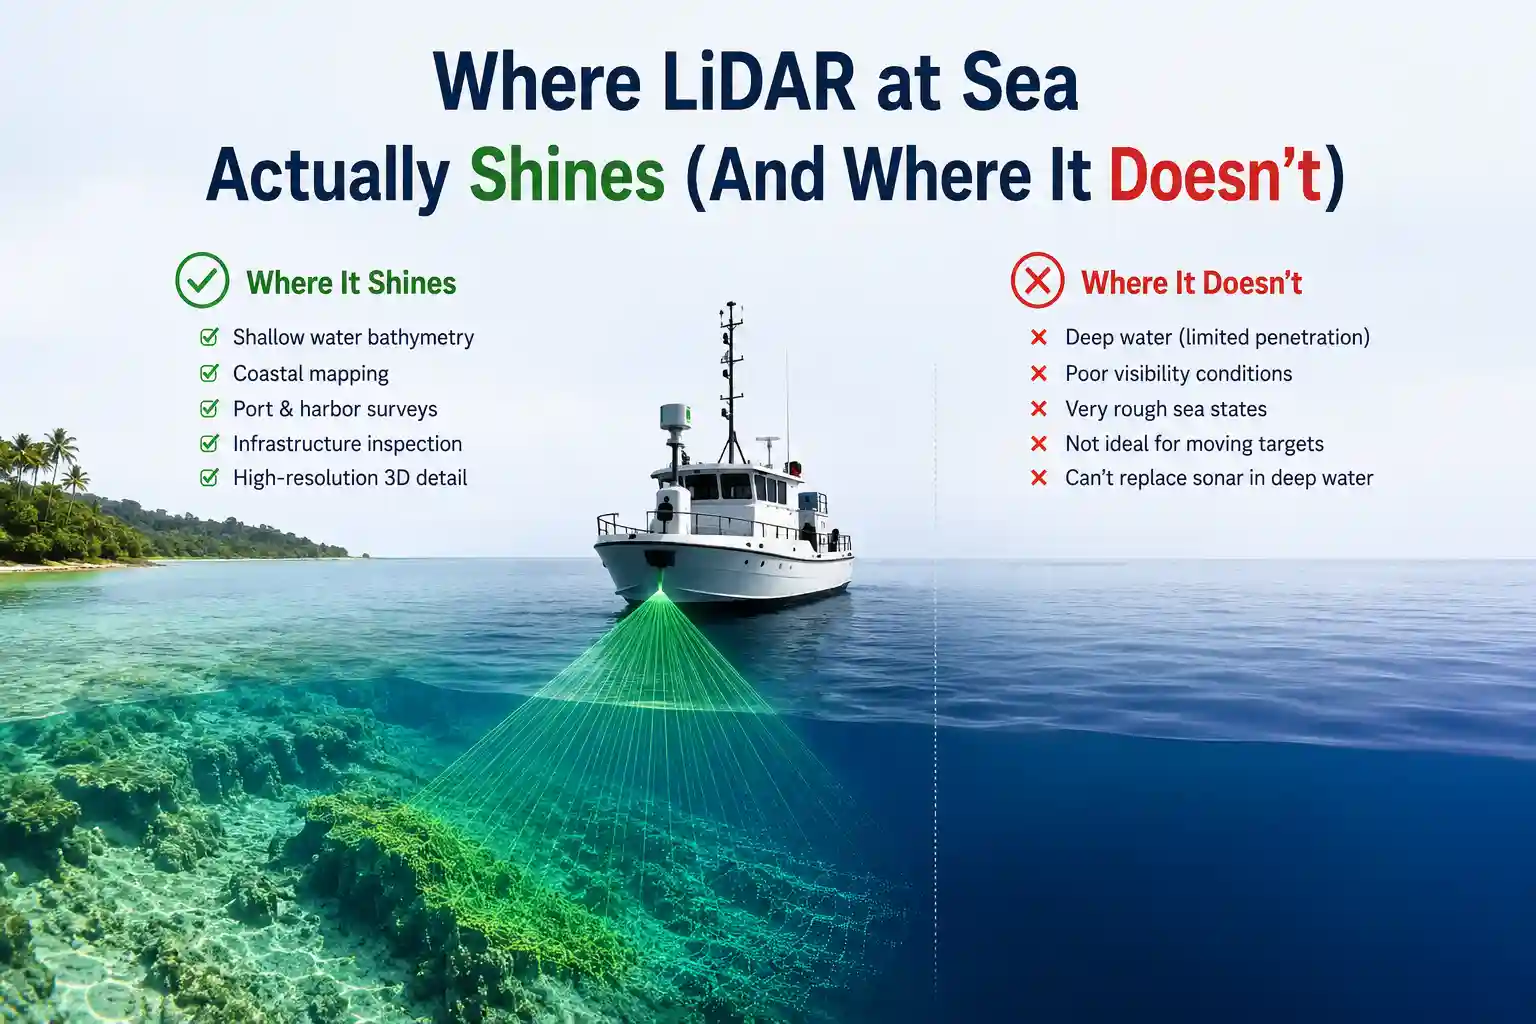
The operational value of marine LiDAR is highly situational. It is not a universal replacement for acoustic surveying. The entities that see a genuine return on investment are those operating in the shallow, clear-water littoral zone.
Dredging companies, for instance, rely heavily on topobathy LiDAR for pre- and post-dredge volume calculations. When working in depths of less than 5 meters, deploying a traditional multibeam echosounder (MBES) on a survey launch is tedious, slow, and requires constant sound velocity profiling. A vessel-mounted LiDAR can cover the same shallow footprint much faster, provided the water clarity is adequate. Coastal engineering firms mapping shoreline erosion and beach nourishment projects also benefit, as the system captures both the submerged sandbar and the dry beach in a single continuous dataset.
However, small-scale hydrographic surveyors often struggle to justify the deployment. The capital expenditure for a marine-grade topobathy system, including the requisite high-end INS and processing workstations, easily exceeds $400,000. Beyond the hardware, the maintenance realities are steep. The sensor requires factory recalibration annually. The processing software licenses are subscription-based and expensive.
Furthermore, the training burden is immense. Operating the hardware is only 20% of the job. The other 80% is point cloud processing. Cleaning the data, classifying the returns (separating the seafloor from the water surface, kelp, and fish), and merging the topographic and bathymetric datasets requires specialized software skills that traditional hydrographers, who are used to acoustic soundings, often lack. The infrastructure requirements for data storage are also non-trivial; a single week of surveying can generate upwards of 10 terabytes of raw LAS files, requiring robust shipboard NAS (Network Attached Storage) arrays and fast shore-side transfer protocols.
Acoustic vs. Optical: Practical Comparisons
Comparing vessel-mounted LiDAR to traditional multibeam echosounders reveals distinct operational trade-offs. It is less about which technology is superior and more about which tool fits the specific environmental constraints of the day.
Water Column Penetration: MBES uses sound, which travels exceptionally well through water regardless of clarity. LiDAR uses light, which is absorbed and scattered by particulates. In the turbid estuaries of the Gulf Coast, MBES is the only viable option. In the clear, shallow reefs of the Caribbean or the Pacific atolls, LiDAR provides a level of spatial resolution and coverage speed that acoustic systems struggle to match.
Environmental Corrections: Acoustic systems require constant sound velocity profiles (SVP) because the speed of sound changes with temperature, salinity, and pressure. If you don’t cast an SVP probe regularly, your acoustic data will warp. LiDAR does not require SVP casts. The speed of light in water is relatively constant for the purposes of shallow surveying, though refraction at the air-water interface must be mathematically modeled. This eliminates the physical labor of dropping SVP probes, but replaces it with the need for precise water surface detection algorithms.
Survey Speed and Line Spacing: In very shallow water (under 3 meters), an MBES swath becomes incredibly narrow. To get full bottom coverage, the vessel must run survey lines spaced just a few meters apart, which is agonizingly slow. LiDAR, projecting from above the water, maintains a wide swath even in ankle-deep water, allowing for much wider line spacing and faster area coverage.
Automated vs. Manual Oversight: Modern MBES systems have highly matured automated QA/QC pipelines. The acoustic returns are well-understood, and anomalies are easily flagged. LiDAR point clouds, particularly in the surf zone where the laser is hitting breaking waves, foam, and suspended sand, create massive amounts of “noise.” Automated classification algorithms frequently misclassify dense sea foam as solid ground, requiring hours of manual editing by a technician in the office. The promise of automated processing often breaks down in the messy reality of the surf zone.
Expert Analysis: The Physics and Logic of Marine Optics
To understand why marine LiDAR behaves the way it does, you have to look at the underlying marine operational logic and the physics of the environment. The primary challenge is the air-water interface.
When a green laser pulse hits the water, a portion of the energy reflects off the surface (the surface return), and a portion refracts into the water column (the bottom return). The system’s receiver must be sensitive enough to detect the faint bottom return without being blinded by the massive surface return. In calm water, this is manageable. But when the wind chops the surface into thousands of tiny, angled facets, the laser light scatters in multiple directions. The receiver gets flooded with scattered light, and the signal-to-noise ratio plummets.
This is why survey operators constantly monitor the “Secchi disk depth” or water clarity. If the water clarity drops below a certain threshold, the optical attenuation coefficient rises, and the laser simply cannot reach the bottom. There is no software fix for this. You either wait for the water to clear or you switch to acoustics.
Communication reliability and hardware degradation also play massive roles. The sensor head on the mast is connected to the control cabin via thick, heavy umbilical cables carrying power, fiber optics, and serial data. These cables must pass through watertight bulkheads. Over time, the constant vibration of the vessel and the flexing of the mast degrade the internal wiring. We’ve seen situations where a microscopic fracture in a fiber optic line caused intermittent data dropouts that only occurred when the vessel rolled to port. Diagnosing that issue took three days of swapping components and running continuity tests.
Human workflow adaptation is another hidden factor. The crew has to change how they drive the boat. With acoustics, the helmsman focuses on keeping the vessel steady and on the track line. With LiDAR, the helmsman also has to be acutely aware of the sun’s azimuth. If the vessel is heading directly into the rising or setting sun, the glare can saturate the LiDAR’s optical receivers, blinding the sensor. Survey lines often have to be scheduled around the sun’s position, adding a layer of logistical complexity to the daily sail plan.
The Unavoidable Drawbacks of Optical Deployment
No technology is without its flaws, and the physical realities of operating precision optics at sea introduce a specific set of frustrating drawbacks. These are the issues that don’t make it into the sales presentations.
Corrosion and Connector Degradation: Salt spray is relentless. Even with marine-grade stainless steel and anodized aluminum, the electrical connectors on the sensor housing are vulnerable. Salt creep inevitably finds its way into the pin interfaces, causing voltage drops and data errors. Crews spend an inordinate amount of time cleaning connectors with contact cleaner and applying dielectric grease, only to have to repeat the process a week later.
Optical Window Pitting: The protective glass or sapphire window over the laser aperture takes a beating. In high-current environments with suspended sand, the window gets sandblasted. Over a season, microscopic pits form in the glass, scattering the outgoing laser pulse and degrading the return signal. Replacing these windows is expensive and requires breaking the factory pressure seal, which is not a task you want to perform on a rocking boat in the field.
Dashboard Clutter and QA/QC Fatigue: The operator’s dashboard in the cabin is often a mess of overlapping windows showing the GNSS status, INS alignment, laser temperature, PRF rates, and real-time point cloud. When the system encounters an error, it often throws a cascade of generic QA/QC flags. Sorting out whether a data gap was caused by a momentary GNSS multipath error, a wave splashing the lens, or a thermal throttle requires deep system knowledge and causes significant operator fatigue.
Weather Interference and Attenuation: It isn’t just water clarity that stops the job. Rain and heavy fog severely attenuate the laser pulses. A light drizzle that wouldn’t stop an acoustic survey will completely wash out a LiDAR point cloud, forcing the vessel to return to port and burn through the day’s operational budget.
Software Usability and Proprietary Formats: The processing software required to handle topobathy data is notoriously complex. Furthermore, different manufacturers use proprietary raw data formats. Converting these files into standard, open formats (like ASPRS LAS) for delivery to clients or government archives (such as NOAA’s NCEI) often results in metadata loss or formatting errors that require manual coding to fix.
Installation Delays and Mounting Stiffness: You cannot simply bolt a LiDAR to a standard boat radar arch. The mast must be incredibly stiff. If the mast flexes or vibrates at the same frequency as the scanner’s rotation, it introduces high-frequency noise into the INS data. Designing and fabricating a custom, rigid mounting bracket often delays vessel mobilization by weeks.
Sensor Degradation and Laser Aging: The laser diodes have a finite operational lifespan. As they age, their output power degrades, reducing the maximum depth penetration. Operators have to constantly monitor the laser power output and adjust their survey expectations as the hardware ages between factory servicing intervals.
Standards, Compliance, and the Human Element
When deploying these systems for official hydrographic charting, compliance with international standards is mandatory. The International Hydrographic Organization (IHO) S-44 standards dictate strict limits for Total Vertical Uncertainty (TVU) and Total Horizontal Uncertainty (THU).
Meeting IHO Special Order standards with LiDAR in shallow water is entirely feasible, but as the water depth increases, the optical scattering makes it increasingly difficult to guarantee the required vertical accuracy. This is where the human element of the surveyor becomes critical. A seasoned hydrographer knows when to trust the LiDAR data and when to cross-line the area with a multibeam system to verify the depths. Blindly trusting the automated processing pipeline is a recipe for publishing inaccurate nautical charts.
Institutions like the University of New Hampshire’s Center for Coastal and Ocean Mapping (CCOM) have spent years researching the exact error budgets of topobathy LiDAR, specifically looking at how wave kinematics and refraction models impact the final depth calculation. Their research highlights a fundamental truth: the sensor is only as good as the environmental model applied to its data. If the software assumes a flat water surface but the actual sea state is a complex chop, the depth calculations will be wrong. The surveyor must manually adjust the refraction indices and surface models, a tedious process that requires a deep understanding of both the oceanography and the software algorithms.
The Operational Verdict
Vessel-mounted LiDAR is a highly specialized tool that solves specific problems in the shallow, clear-water littoral zone better than any acoustic alternative. It bridges the gap between the dry beach and the shallow surf, providing continuous topographic and bathymetric data that is invaluable for coastal management, dredging, and habitat mapping.
But it is not a magic wand. It demands rigorous maintenance, highly trained operators, and a deep tolerance for environmental delays. The ocean does not accommodate precision optics easily. Salt crusts on the lenses, suspended mud blocks the lasers, and the relentless motion of the sea tests the limits of the inertial sensors.
The crews who succeed with this technology are not those who expect it to work perfectly out of the box. They are the ones who carry extra squeegees, know how to solder a coaxial connector in a cramped cabin, and understand that the most important component of the survey system isn’t the laser itself, but the human operator watching the dashboard, waiting for the sea state to drop just enough to get a clean return.