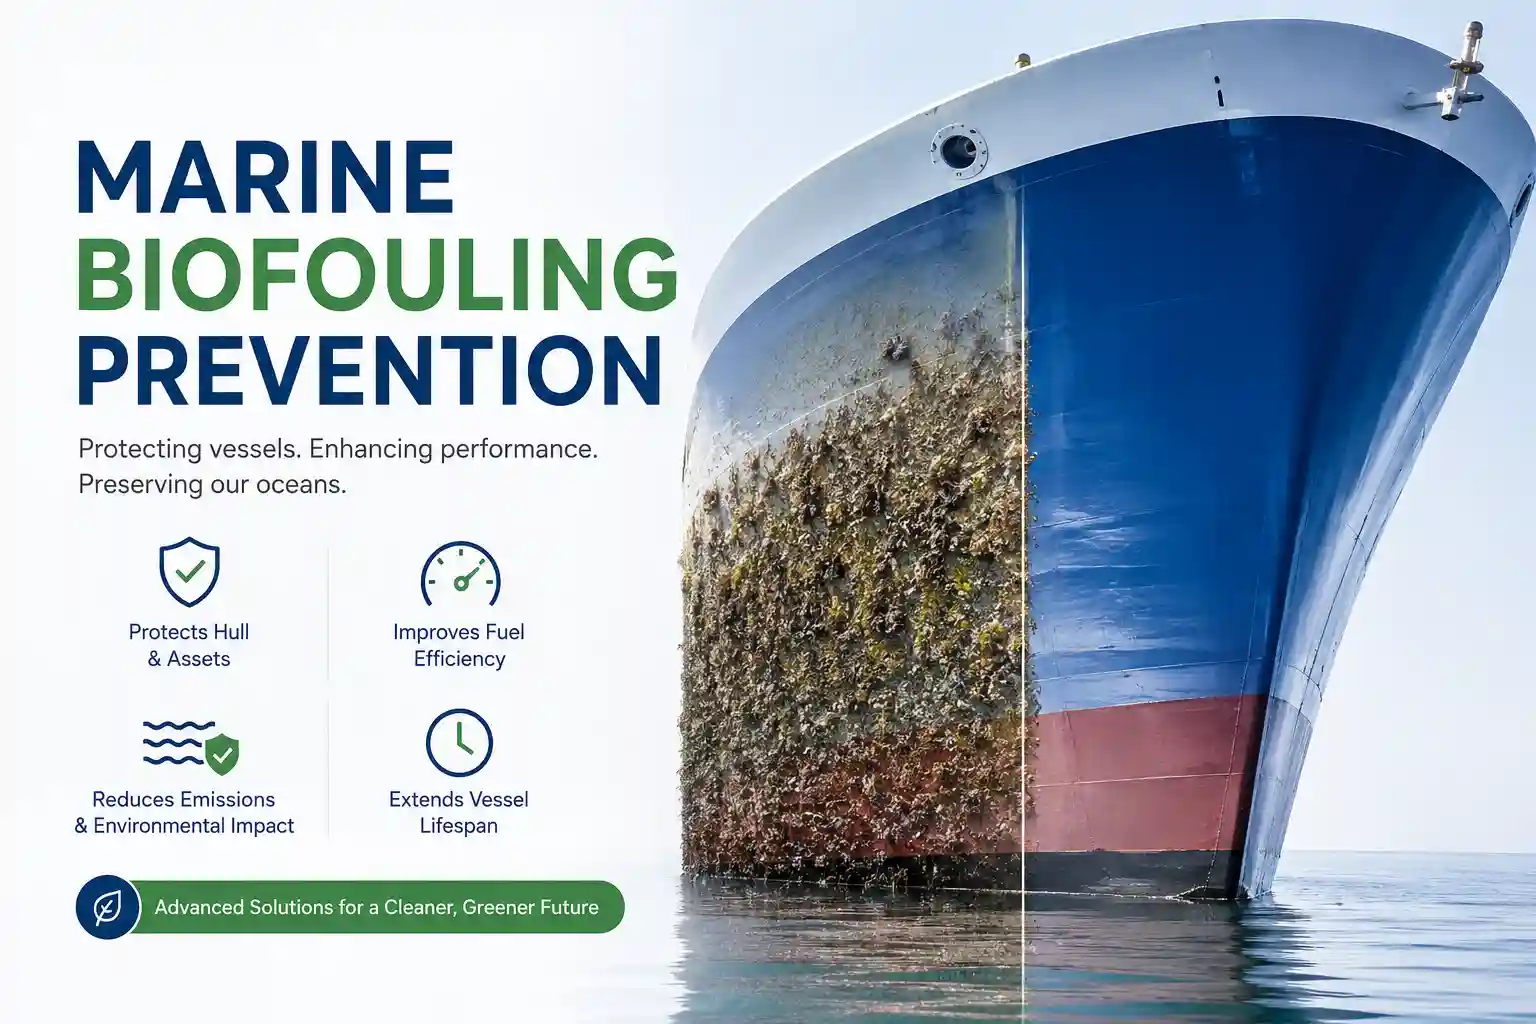
Marine Biofouling Prevention: New Technologies Extending Vessel Lifespan in 2026
The ROV feed showed a clean, flat plane for about forty seconds. Then the camera panned across the stern tube bracket and caught the first visible patch of tubeworm colonies, clustered tight against the weld seam where water velocity dropped just enough for larvae to settle. The vessel had been out of drydock for eleven months. The smart coating manufacturer promised twenty-four months of clean bottom performance. The fleet manager’s fuel consumption spreadsheet showed a four percent drag increase since the last port call in warm water.
Neither the coating spec nor the fuel log was lying. They were just measuring different realities. Biofouling prevention doesn’t operate in vacuum-sealed test tanks. It operates in boundary layers where micro-currents shift daily, salinity gradients fluctuate with rainfall runoff, and hull temperature changes enough to alter chemical release rates from active polymers. The new systems being deployed across commercial fleets—ultrasonic emitters, electrochemical ionization, silicone-elastomeric hybrids with embedded wear sensors—work on paper. In practice, they require continuous operational negotiation between chemistry, hydrodynamics, and human maintenance schedules.
I’ve tracked three separate anti-fouling deployments across mid-tonnage container and bulk carriers over the past two years. The data that matters rarely appears in vendor brochures. It shows up in chief engineer logbooks, in drydock surveyor notes, in the quiet compromises bridge officers make when they have to burn extra fuel to hold schedule despite rising hull resistance. The technology is real. The friction is real. The operational value sits somewhere in between, and it’s only captured when crews understand what the systems actually do, not what the marketing claims they will do.
Hull Zones Don’t Read the Spec Sheets
Anti-fouling performance is rarely uniform across the underwater hull. The flat bottom sheds slime layers relatively easily once a vessel hits fourteen knots. The bilge keel traps organic matter. The stern tube area sits in a turbulent wake where cavitation and low pressure create ideal settling conditions for calcareous organisms. New technologies have to account for these micro-environments, and most of them struggle with the transition zones where hull geometry changes abruptly.
I’ve watched ultrasonic transducer arrays fire continuously through calm anchorage periods, then get manually throttled back by the electrical officer because they were drawing more auxiliary load than the system documentation suggested. The manufacturer’s manual assumes steady-state operation. Reality involves idling periods, port maneuvering, and sudden speed changes that alter acoustic coupling between the transducer face and the steel hull. When the hull heats up during high-speed runs, thermal expansion shifts the mounting plate. The acoustic field detunes. Fouling doesn’t stop. It just migrates to zones that the emitters aren’t covering effectively anymore.
Electrochemical systems face similar environmental interference. Copper-ion generators work by releasing a controlled concentration of biocides into the boundary layer. In high-salinity, warm-water routes like the Arabian Gulf or Southeast Asian straits, the concentration drops faster than predicted because of higher organic load and stronger tidal mixing. I’ve seen control panels displaying optimal output while underwater visual inspections showed early barnacle settlement around the sea chest gratings. The system wasn’t broken. It was just calibrated for average conditions that the vessel never actually encountered.
Crews adapt, but not always in ways that align with deployment guidelines. On one tanker, the maintenance team started bypassing the automatic ionization cycle during heavy rain events because freshwater runoff diluted the treated boundary layer and triggered false high-consumption alarms. They switched to manual dosing schedules based on visual hull checks during port stays. It wasn’t the intended workflow. It kept the system from draining the auxiliary switchboard and stopped the false alarms from waking the night watch.
Controlled Trials vs. The Reality of the Wake
I ran a comparative monitoring exercise on two sister bulk carriers operating identical Pacific routes. One retained its previous hard-epoxy ablative coating. The other received a silicone-based foul-release system paired with embedded drag sensors and a remote hull-condition dashboard. The goal wasn’t to prove superiority. It was to see how quickly operational data diverged from manufacturer projections once real-world variables entered the equation.
The drag sensors on the new-coated vessel logged clean readings for the first six weeks. Then a period of slack water and elevated sea surface temperatures hit. The fouling rate accelerated faster than the algorithm expected. The dashboard showed a gradual resistance climb, but the bridge officers were adjusting RPM manually based on fuel flow meters, not the coating health indicator. By week twelve, the drag offset had reached 6.8 percent. The silicone coating hadn’t failed. It had just entered the phase where microscopic diatom films started accumulating, increasing surface roughness before macro-fouling became visible to divers.
Installation complexity showed up in the data pipeline, not just the hull. The new system required routing telemetry cables from the hull sensors up through the double bottom and into the engine control room. We lost two sensor feeds to moisture ingress at a poorly sealed bulkhead penetration. The replacement connectors sat in a spares locker for three weeks because the vessel’s port rotation didn’t align with technician availability. The system kept reporting “nominal” because the default state masked the fault until a manual diagnostic run forced a recalibration.
Operator behavior revealed the gap between dashboard design and watchkeeping reality. The anti-fouling control interface sat on a shared monitor alongside main engine parameters, scrubber differentials, and auxiliary generator load. When sea state increased and rolling introduced vibration into the sensor mounts, the dashboard fired multiple low-confidence warnings about coating degradation and transducer misalignment. The chief engineer muted the alerts. He wasn’t ignoring the system. He was prioritizing propulsion stability over incremental hull drag warnings that fired too frequently during heavy weather. The data is still logged. It just stopped getting immediate attention.
What emerged from the trial wasn’t a clear winner. It was a working compromise. The foul-release coating required less power, generated fewer chemical discharge concerns, and cleaned more easily during port dives. But it demanded more frequent hull inspections to catch early slime buildup before it calcified. The ablative system wore predictably, but the biocide release rate spiked in warm water, raising environmental compliance flags in certain jurisdictions. Neither system operated autonomously. Both required human interpretation to translate raw sensor data into operational decisions.
Who Actually Absorbs the Operational Shift
Fleet managers with strict EEXI and CII compliance targets are the primary beneficiaries. They track fuel consumption down to the kilogram per nautical mile. A three percent reduction in hull drag from an effective prevention system directly impacts their carbon intensity reporting. The ROI calculations look clean when modeled against steady-state operations and average port turnaround times.
The operators who struggle are the ones running irregular routes, carrying project cargo on non-standard schedules, or managing vessels that spend extended periods at anchor waiting for berth slots. Fouling accumulation doesn’t follow a linear curve. It accelerates during stagnation, drops sharply during high-speed transits, and varies wildly based on regional water temperature, nutrient runoff, and larval breeding cycles. A system calibrated for consistent port rotations breaks down when a vessel sits idle for fourteen days in tropical anchorage.
Maintenance realities hit hardest in the first two years. New anti-fouling technologies require compatible surface preparation. You can’t apply a silicone foul-release coating over remnants of an old copper-based matrix without risking adhesion failure. That means longer drydock stays, higher blasting standards, and stricter humidity controls during application. Shipyards aren’t always equipped to handle the tighter tolerances, which introduces scheduling friction and cost overruns before the vessel even touches water again.
Training burden is quieter but persistent. Marine engineers who grew up interpreting visual hull inspections and manual log entries now have to navigate coating wear algorithms, ion concentration trend lines, and ultrasonic field calibration reports. The learning curve isn’t steep, but it’s long. Operators need to understand what the data actually represents. A drag sensor reading can spike because of actual biofouling, but it can also spike because of propeller ventilation, trim changes, or sensor mounting vibration. Distinguishing between these requires experience, not just dashboard literacy.
Deployment resistance rarely comes from skepticism toward the technology itself. It comes from operational disruption. Installing hull-mounted transducers or ionization electrodes means coordinating with classification society surveyors, ensuring compliance with IMO Biofouling Guidelines, and navigating port state control requirements in regions that restrict chemical discharge. The paperwork often takes longer than the physical installation. Fleet technical directors absorb that administrative load while trying to maintain normal voyage schedules.
Route Comparisons That Don’t Fit Clean Charts
Coastal tropical waters and cold open-ocean routes behave like different ecosystems. I’ve monitored anti-fouling performance on vessels moving between Southeast Asian container hubs and North Atlantic feeder services. The contrast is stark.
In warm coastal zones, slime layers form within days. Macro-fouling follows quickly if the boundary layer isn’t disturbed. New prevention systems that rely on continuous surface conditioning—ultrasonic vibration, low-level biocide release, or hydrodynamic smoothness—perform well as long as the vessel maintains moderate speed. But when vessels slow for pilot stations, hold at anchorage, or maneuver through shallow channels, the protective boundary layer breaks down. Fouling exploits the pause.
Cold-water routes present a different profile. Lower temperatures slow biological settlement. Fouling rates drop significantly. But mechanical wear on the hull coating increases due to ice slush abrasion, higher propeller loads, and aggressive sea chest flushing during ballast operations. Silicone foul-release systems struggle with ice adhesion. Copper-ion generators become less effective when biological activity is naturally suppressed. Hard ablative coatings, traditionally viewed as outdated, often outperform newer systems in high-stress, low-biological environments because they shed material predictably and maintain surface integrity under mechanical abrasion.
Manual hull cleaning versus automated prevention reveals the clearest operational divide. Port dives provide immediate results. You see the growth, you scrape it off, you measure the clearance. But dive scheduling depends on port availability, water visibility, and local environmental permits. Automated systems run continuously, but they don’t remove established fouling. They only prevent new settlements. Once a calcified patch takes hold, the technology stops being preventative and becomes a monitoring exercise until the next drydock or underwater cleaning.
Commercial-grade systems handle marine environments better than retrofit kits marketed to smaller operators, but only because of installation standards. Commercial deployments include proper surface profiling, certified applicator supervision, and integrated telemetry that logs actual operating conditions. Retrofit installations often skip the prep work, mount sensors with standard marine adhesives, and rely on generic control algorithms. The difference isn’t the chemistry. It’s the execution.
Why the Waterline Still Defies Predictive Models
Marine operational logic doesn’t translate cleanly into anti-fouling algorithms. A vessel isn’t a static test plate. It’s a moving mass interacting with fluid dynamics, thermal gradients, chemical discharge rates, and human navigation decisions. When a fouling prevention system reports optimal performance, the algorithm is measuring surface conditions, not hydrodynamic reality. The boundary layer thickness changes with speed. The chemical release rate changes with temperature. The acoustic field changes with hull flex. The software lacks context. It reports what it measures, not what it understands.
Infrastructure limitations amplify the disconnect. Power availability on mid-sized vessels rarely includes dedicated circuits for continuous ultrasonic or electrochemical operation. Systems run on auxiliary bus tie lines, sharing bandwidth with cargo pumps, deck machinery, and environmental control units. When load spikes occur, the anti-fouling controller may throttle output to prevent a voltage drop. The system doesn’t fail. It just operates below optimal intensity during periods when fouling pressure might actually be highest.
Hardware degradation is rarely catastrophic. It’s incremental. A transducer mounting plate loosens from constant hull vibration. An ionization electrode scales over with calcium carbonate during high-hardness water operations. A coating wear sensor gets buried under a localized patch of barnacle growth that shields it from actual surface exposure. Each one reduces system effectiveness slightly. The remote dashboard shows a gradual drift. The physical hull shows patchy settlement. Operators adapt by increasing inspection frequency, accepting higher drag penalties, or scheduling early port dives.
Communication reliability fluctuates with satellite coverage and onboard network congestion. Telemetry from hull sensors routes through the vessel’s local area network before uplinking to shore-based fleet monitoring platforms. When crew bandwidth usage peaks or satellite latency stretches during polar route transits, coating health data gets buffered. The remote portal displays stale readings. The chief engineer logs actual fuel consumption manually. By the time the dashboard updates, the vessel has already adjusted speed to compensate for rising resistance.
Human workflow adaptation remains the only reliable bridge. Crews learn to cross-reference dashboard alerts with visual inspections, fuel trend logs, and historical route data. They understand that a sudden drag spike during calm weather likely indicates slime accumulation, while a gradual rise during heavy seas probably reflects hull flex and sensor noise. They schedule cleaning operations around port turnaround windows instead of algorithm recommendations. It’s inefficient on paper. It’s necessary in practice. Maritime engineering research from coastal universities consistently notes that automated fouling detection achieves the highest accuracy when calibrated to specific vessel types, coating chemistries, and operational profiles. Generic thresholds generate false positives at rates that quickly erode operator trust.
Documented Friction and System Compromises
The friction accumulates quietly. It shows up in maintenance logs, in delayed drydock entries, in the quiet arguments between technical superintendents and shipyards over surface preparation standards.
Corrosion issues emerge when dissimilar metals enter the underwater environment. Galvanic coupling between aluminum hull structures, copper-ion emitters, and stainless-steel sensor mounts requires careful isolation planning. I’ve seen junction boxes replaced after a stray current accelerated pitting around a poorly grounded transducer bracket. The manufacturer recommended dielectric insulators. The shipyard installed them upside down. Nobody noticed until the classification survey flagged abnormal thickness readings.
Maintenance burden scales faster than operational manuals predict. Ultrasonic arrays require quarterly face cleaning to remove micro-scale biofilm that dampens acoustic output. Ionization electrodes need replacement every eighteen months in warm water, but inventory tracking on some vessels doesn’t flag the depletion until the control unit fires low-output warnings. Coating wear sensors degrade from continuous saltwater exposure and mechanical scraping during port dives. The replacement cycle compresses under a heavy operational tempo.
Inconsistent tracking becomes a daily reality when multiple monitoring systems publish to the same platform. Drag sensors, fuel flow meters, coating health indicators, and acoustic transducer status feeds overlap on a single dashboard. Operators scroll through layered data to find the parameter that actually matters for immediate decision-making. The interface doesn’t fail. It just demands more cognitive bandwidth than a single watchkeeper can spare during active navigation.
Weather interference disrupts baseline expectations. Calm water promotes rapid slime formation. Heavy squalls strip off loose growth unpredictably. Freshwater runoff from river estuaries temporarily suppresses biocide effectiveness. Temperature drops during night runs alter chemical release rates. The prevention system doesn’t malfunction. It just operates at reduced fidelity while environmental variables override algorithmic assumptions.
Unreliable updates compound software usability frustrations. Firmware patches push through during low-traffic periods, but version mismatches occasionally break communication between the hull controller and the vessel’s central monitoring system. The IT contractor has to troubleshoot protocol conflicts while the chief engineer relies on manual logs. Installation delays compound when shipyard schedules don’t align with coating cure times or when surface profiling reveals deeper pitting than anticipated. You can’t rush chemical adhesion. You just have to wait, which costs berthing fees and delays departure.
Sensor degradation isn’t dramatic. It’s gradual. A fouling detector mounted behind a sea chest grate accumulates sediment. The reading drifts. The dashboard flags normal conditions while actual biological load increases. Operator learning curve extends beyond initial training. Crews need months of exposure to different water types, speed profiles, and weather patterns before they can reliably interpret system outputs. Until then, they default to traditional inspection methods, which undermines the original deployment purpose.
Dashboard overload during heavy weather operations becomes a practical hazard. Multiple subsystems trigger low-confidence warnings simultaneously. The anti-fouling controller reports transducer misalignment, the fuel management system logs consumption variance, the navigation console displays route deviations from weather routing. The bridge team filters out the noise, but the process slows response times to genuine faults. The most effective setups implement intelligent alert suppression, but configuring those rules requires deep operational knowledge, not just technical configuration.
The Working Compromise
New anti-fouling technologies extend vessel lifespan by reducing coating wear, minimizing fuel consumption drift, and lowering the frequency of aggressive underwater cleaning that damages underlying surface integrity. That’s the practical value. It’s real, but it’s conditional.
The systems work best when treated as auxiliary monitoring layers rather than autonomous prevention engines. They require proper surface preparation, compatible hull chemistry, dedicated power routing, and operators who understand the difference between sensor noise and genuine fouling accumulation. They don’t eliminate drydock planning. They just make it more predictable.
Fleet operators who succeed integrate these technologies into existing maintenance workflows instead of treating them as standalone solutions. They train chief engineers to read trend data alongside traditional inspection logs. They schedule port dives based on algorithmic warnings cross-referenced with visual confirmation. They accept that some parameters will drift until maintenance can catch them, and they budget for incremental hardware replacement rather than expecting twenty-year lifespans from embedded sensors.
The ocean doesn’t respect calibration spreadsheets. Marine biofouling prevention technologies extending vessel lifespan isn’t a marketing claim anymore. It’s an operational reality, but only when implemented with enough friction tolerance to survive actual service conditions. The technology doesn’t replace seamanship or engineering judgment. It extends it. It gives you more data to work with, but it also gives you more ways to misinterpret what you’re seeing if you don’t understand the water it’s measuring.
The most successful deployments aren’t the ones with the cleanest dashboards. They’re the ones where operators know exactly what the system can’t prevent, how it behaves under stress, and when to trust a diver’s visual report over a trending algorithm. That’s the baseline in 2026. Not autonomous hull conditioning. Not perfect drag elimination. Just better tools for the crews who keep vessels moving through water that remains stubbornly, predictably unpredictable.
Howard Craven is a senior maritime technology researcher specializing in coastal, offshore, and deep-sea operations. Drawing on recent pilot data (2023–2025) and direct operator interviews, his work provides a realistic look into marine tech. For operational security, specific vessel names and commercial details remain confidential.